
Annual report on competitions
This page presents highlights from the annual report on competitions. For details and access to the full report, visit Open Government to read the 2023-24 report on competitions.
Enriching the merit review process
As part of SSHRC’s commitment to continuous improvement, we analyze data on merit review results, as well as feedback from our staff, merit reviewers and observers, in an annual report on competitions.
All findings in the report are reviewed at the program level and by governance committees, helping us build on successes and make informed changes to improve our programs. The report represents our dedication to transparency and facilitates positive change to address challenges in the merit review process.
Merit reviewers have shared their thoughts on their experience working with us. Here is what some of them had to say:
“I was very impressed by the staff and their prompt responses and clear explanations, as well as the tools at our disposal (e.g., scoring sheet), which made me feel well prepared for the discussion.”
“This was a positive experience! I enjoyed learning about the kinds of research and KM [knowledge mobilization] being undertaken across the country, meeting colleagues at other institutions and getting another perspective on the SSHRC processes.”
“I would do this again. As a junior scholar, it was an incredibly enriching opportunity in terms of testing my own abilities to review, meeting new colleagues, and engaging in excellent conversations as well as difficult decision-making processes.”
We are grateful to the many experts who contributed to the merit review process, giving their time and sharing valuable insights into their experience.
Highlights from the 2023-24 report
Our support to merit review committees
Overall views of committee member survey respondents (number=352):
rated the support from SSHRC staff as good (10%) or excellent (87%)
rated the quality of SSHRC’s merit review process as good (39%) or excellent (52%)
Aggregated survey respondent views on SSHRC evaluation processes:
rated the evaluation criteria and subcriteria as extremely useful (44%) or useful (48%)
rated the various SSHRC guidelines for evaluation as extremely useful (28%) or useful (50%), overall
rated the evaluation tools SSHRC provides as extremely useful (40%) or very useful (42%), overall
Who were our committee members in 2023-24?
In 2023-24:
- Number of competitions: 22
- Number of committees: 111
- Number of committee members: 1,030
- (43 internationalFootnote 1)
- Average ageFootnote 2: 48.8
- Average number of years servedFootnote 3:
- One: 55%
- Two: 22%
- Three: 15%
- Four: 8%
- Average acceptace rate: 35%
- Average rate of returning membersFootnote 4: 30%
- Number of committee members who withdrew from the process: 79
Self identificationFootnote 5:
- 51.7% Women
- 40.7% Men
- 1.7 OtherFootnote 6
- 3.7% Indigenous persons
- 9.6% Persons with disabilities
- 16% Racialized people (“Visible minorities”)Footnote 7
- 6.8% Prefer not to answer (on average to designated-group questions)
Language profileFootnote 8:
- English: 77%
- French: 23%
Self-reported linguistic capabilities
- English: speak 99%, read 99%, write 99%, aural 98%
- French: speak 68.5%, read 84%, write 60%, aural 81%
Sectoral representation:
- 98.4% Postsecondary
- < 1% Industry
- < 1% Not-for-profit
- 1% Public
Institutional representationFootnote 9:
- 43% Large
- 27.6% Medium
- 20% Small
- 2.1% College
- 4.2% International
- 3.1% Other
Institutional positions:
- 39% Associate professor
- 28.6% Full professor
- 21.5% Assistant professor
- 10.3% Other
- < 1% Adjunct professor
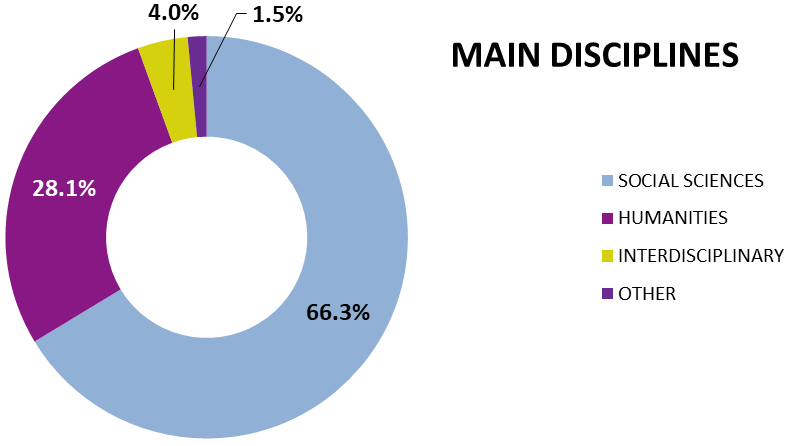
Description of figure 1
Committee member disciplines
The ring graph above shows 66.3% of committee members were from the social sciences, 28.1% were from the humanities, 4% were interdisciplinary and 1.5% were from other disciplines.
Committee workload
Demanding volunteer workloads is a key challenge that we monitor and try to reduce in competition processes. While in recent years the average number of applications assigned to committee members for review has decreased for most competitions, in 2023-24 many committees had a slight increase in member workload. This included: SSHRC Postdoctoral Fellowships, Insight Grants, Insight Development Grants, Partnership Grants —Stage 1, Partnership Development Grants, Partnership Engage Grant and Connection Grants. Of survey respondents in 2023-24 (n=352), 51% cited “workload” as a reason that would deter them from serving again, compared to 58% in 2022-23 (n=418).
Average number of applications assigned to SSHRC committee members for review (2019-24)
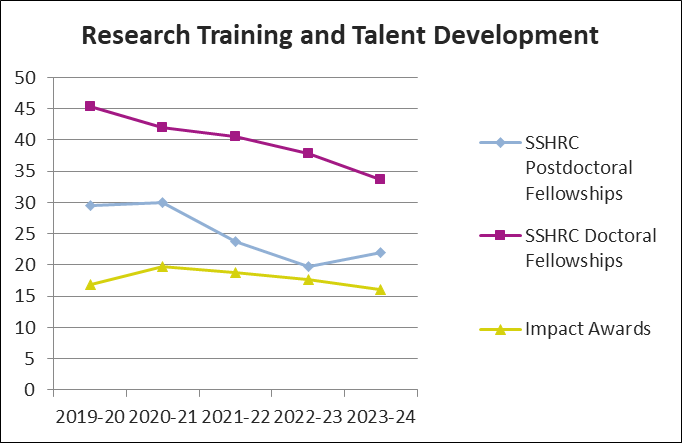
Description of figure 2
Research Training and Talent Development
This three-line graph shows workload trends for Research Training and Talent Development from 2019-20 to 2023-24. For SSHRC Postdoctoral Fellowships, the average number of applications assigned to committee members rose from 19.7 to 22 since the previous year. For SSHRC Doctoral Fellowships, it fell from 37.8 to 33.6 since the previous year. For Impact Awards, it fell from 17.7 to 16 since the previous year.
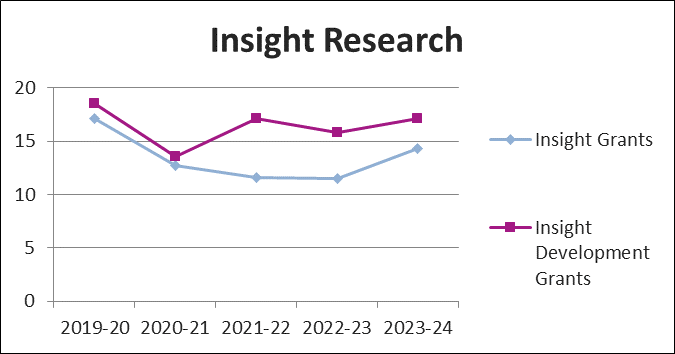
Description of figure 3
Insight Research
The double-line graph above shows workload trends for Insight Research from 2019-20 to 2023-24. The average number of applications assigned to committee members for Insight Grants rose from 11.5 to 14.3 since the previous year. For Insight Development Grants, it rose from 15.8 to 17.1 since the previous year.
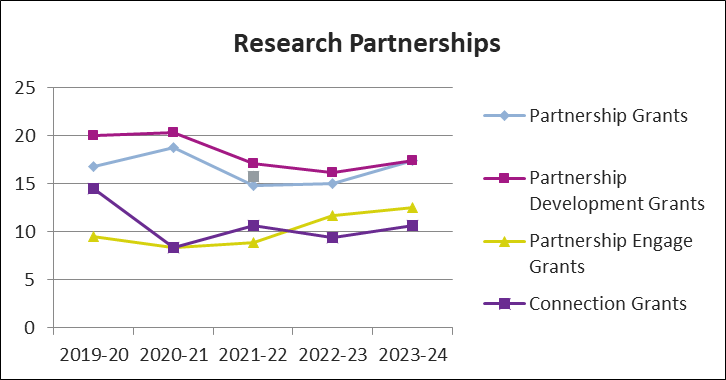
Description of figure 4
Research Partnerships
This four-line graph shows workload trends for Research Partnerships from 2019-20 to 2023-24. The average number of applications assigned to committee members for Partnership Grants rose from 15 to 17.4 since the previous year. For Partnership Development Grants, it rose from 16.2 to 17.4 since the previous year. For Partnership Engage Grants, it increased from 11.7 to 12.5 since the previous year. For Connection Grants, it rose from 9.4 to 10.6 since the previous year.
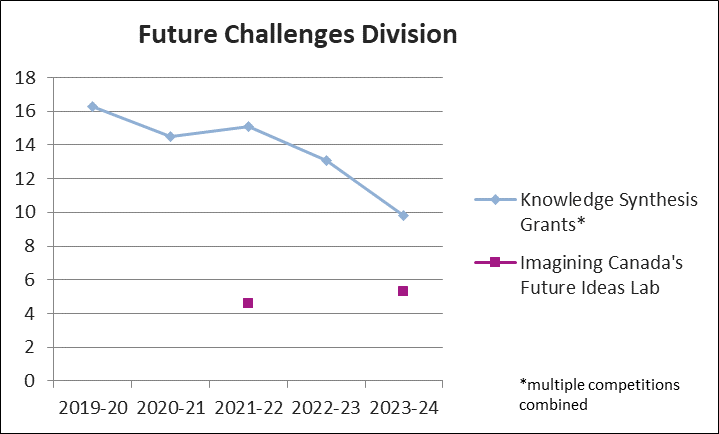
Description of figure 5
Future Challenges Division
The line graph shows the average number of applications assigned for Knowledge Synthesis Grants (KSG) decreased from 13.1 in 2022-23 to 9.8 in 2023-24.
Application language of applicants, overall
- English: 84%
- French: 16%
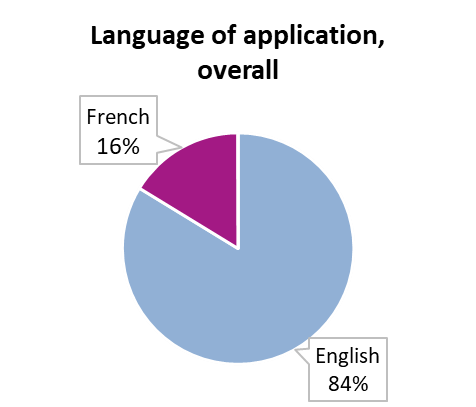
Description of figure 6
Application language of applicants, overall
The pie graph above shows that, overall, 16% of applications were submitted in French and 84% in English.
Application rates by application language
- English: 83.8%
- French: 16.1%
Award rates by application language
- English: 82%
- French: 18%
Correspondence language of committee members, overall
- English: 77%
- French: 23%
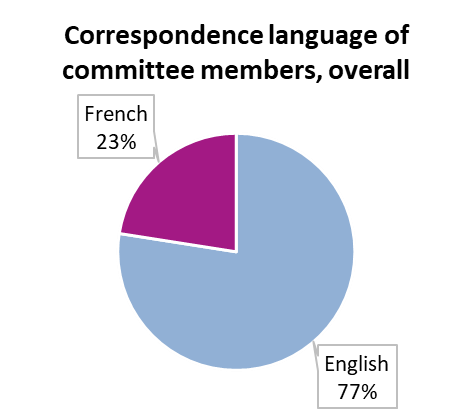
Description of figure 7
Correspondence language of committee members, overall
The pie graph above shows the correspondence language of committee members for the 2023-24 application adjudication year. It shows that, overall, the language of correspondence for 23% of committee members was French, and for 77% English.